
Appendix
Methods
This study continues with the data from the Center for Innovation and Sustainability in Local Media’s Local News for Whom: A News Media Census for North Carolina report. We identified news outlets throughout North Carolina using various sources and searches depending on the medium of the outlet. This study includes newspapers, digital publications, public television stations, public radio stations, commercial television stations, commercial radio stations, magazines, and college media. Outlets needed a minimum amount of content meeting at least one critical information need to be included in the analyses.
A county’s access was measured as the sum of all outlets that specifically mentioned the county as covered on their “About” pages or in available databases and the outlets within the DMA or FCC service contour map a county is a part of.
A county’s total reporting area is the sum of the number of outlets that reported on each county at least twice within the last year for magazines and the previous 30 days for all other media types.
We determined the reporting gap for each county by subtracting the total amount of reporting area across various mediums from the total amount of access across mediums. A reporting-access ratio was computed by dividing the reporting area by the number of outlets a county had access to.
The following demographics for each county in North Carolina were sourced from the U.S. Census Bureau: total population, race, and ethnicity. Median household income, percentage of residents below the poverty level, and education level were sourced from the 5-year estimate of the 2020 American Community Survey. Educational attainment was defined as the number of people in a county who earned at least a bachelor’s degree. Voter turnout was sourced from the North Carolina State Board of Elections. We pulled local turnout from the 2020 Presidential Election.
Regression Models
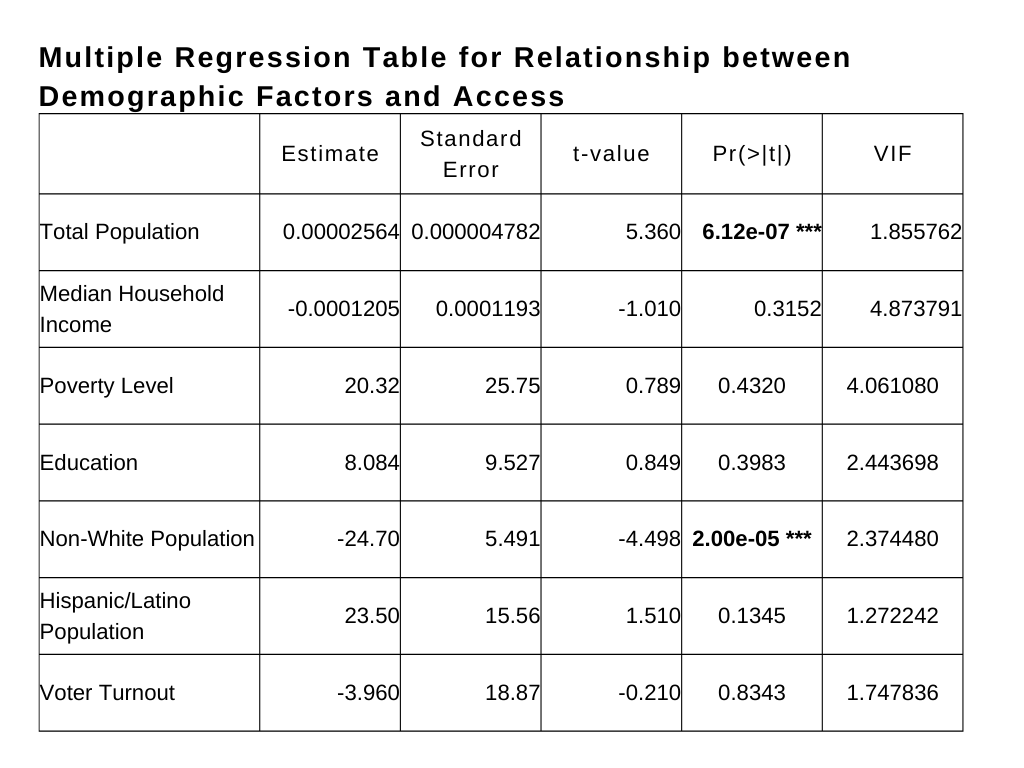
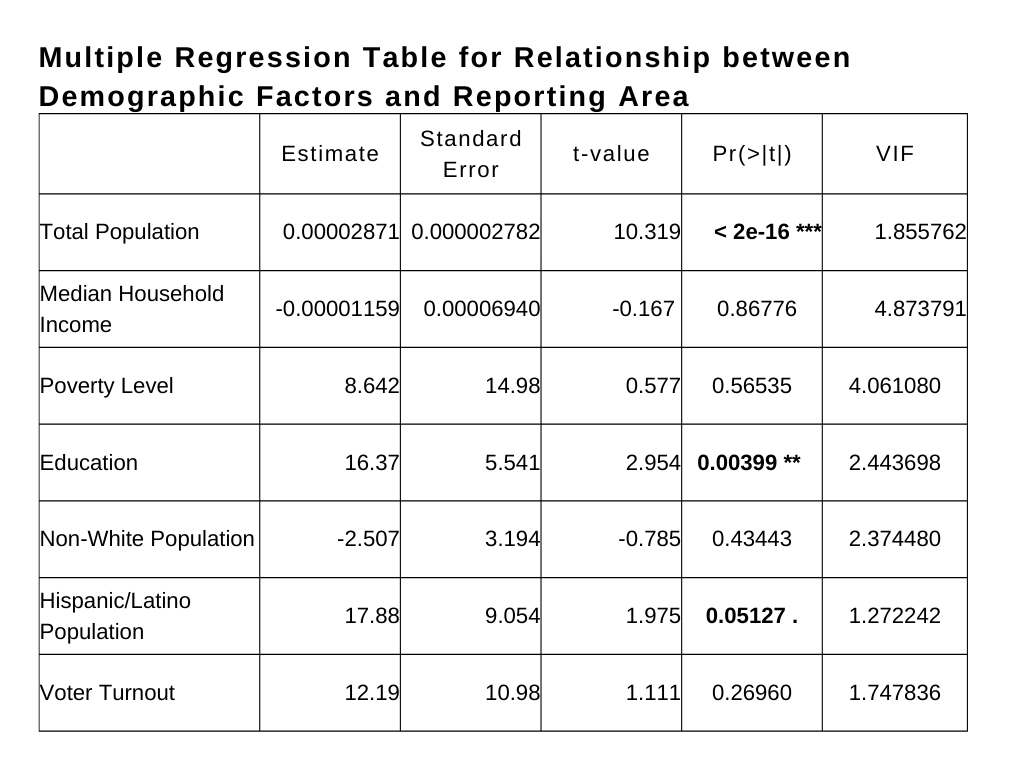
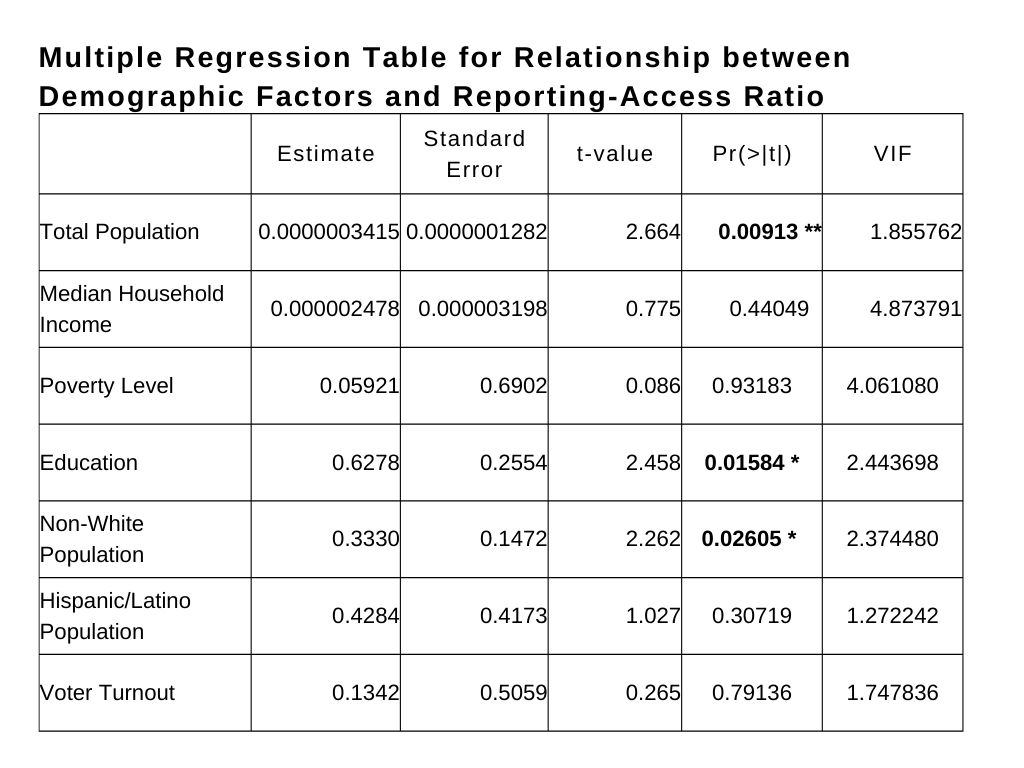
To identify the factors that predict access, reporting area and reporting-access ratio, multiple regression models were constructed using total population, median household income, poverty level, education level, non-white population, percent Hispanic/Latino population and voter turnout. The table below summarizes each model.
Factors were tested for multicollinearity using Variance Inflation Factor (VIF). All VIF values in all models were less than 5.
There was a significant relationship between access and total population and access and non-white population. For each unit increase in population in a county, the number of outlets that county’s residents have access to increased by 0.00002564. For each percent increase in non-white population, access decreased by 24.70.
There was a significant relationship between reporting area and total population, education and Hispanic/Latino population. For each unit increase in population, the number of outlets reporting on a county increased by 0.00002871. For each percent increase in educational attainment,the number of outlets reporting on a county increased by 16.37. For each percent increase in Hispanic/Latino population, the number of outlets reporting on a county increased by 17.88.
 There was a significant relationship between reporting-access ratio and total population, education and non-white population. For each unit increase in population, the percent of access outlets reporting on the county increased by 0.0000003415. For each unit increase in educational attainment, the percent of access outlets reporting on the county increased by 0.6278. For each unit increase in non-white population, the percent of access outlets reporting on the county increased by 0.330.
Correlation Matrix
A Pearson’s R correlation matrix was constructed to understand more about how demographic characteristics are related to one another. The table below shows a moderate to strong correlation between population and educational attainment.
