Factors Affecting Counties’ News Media Access and Reporting
To identify factors contributing to counties’ news media ecosystems, we collected data on race, ethnicity, household income, poverty, and education level in each county from the U.S. Census Bureau and voter turnout from the state Board of Elections. Multiple regression models were used to identify the demographic factors contributing the number of outlets a county’s residents have access to, the number of outlets reporting on that county, and the magnitude of the gap between the two. The full regression table is in the appendix, along with more details about our methods and analyses.
What Demographic Factors Determine a County’s Access to Local News?
Our previous analysis found that North Carolina counties have access to a median of 22 news outlets. However, there were considerable differences among individual counties. In this analysis, we wanted to understand the factors contributing to disparities across counties.
The results of a multiple regression model showed that a county’s total population and percentage of non-white residents were the only significant predictors of the number of outlets a county’s residents have access to. Counties with a higher population have access to more news outlets and counties with a higher proportion of non-white residents have access to fewer.
Population and access
Consistent with other studies of local news ecosystems, we found that population is a significant factor in the number of outlets a county’s residents have access to. To adjust for this and make comparisons, the following analyses use a per capita measure of outlets per 10,000 residents. The typical county in North Carolina has access to a median of six outlets per 10,000 people.

Race and access
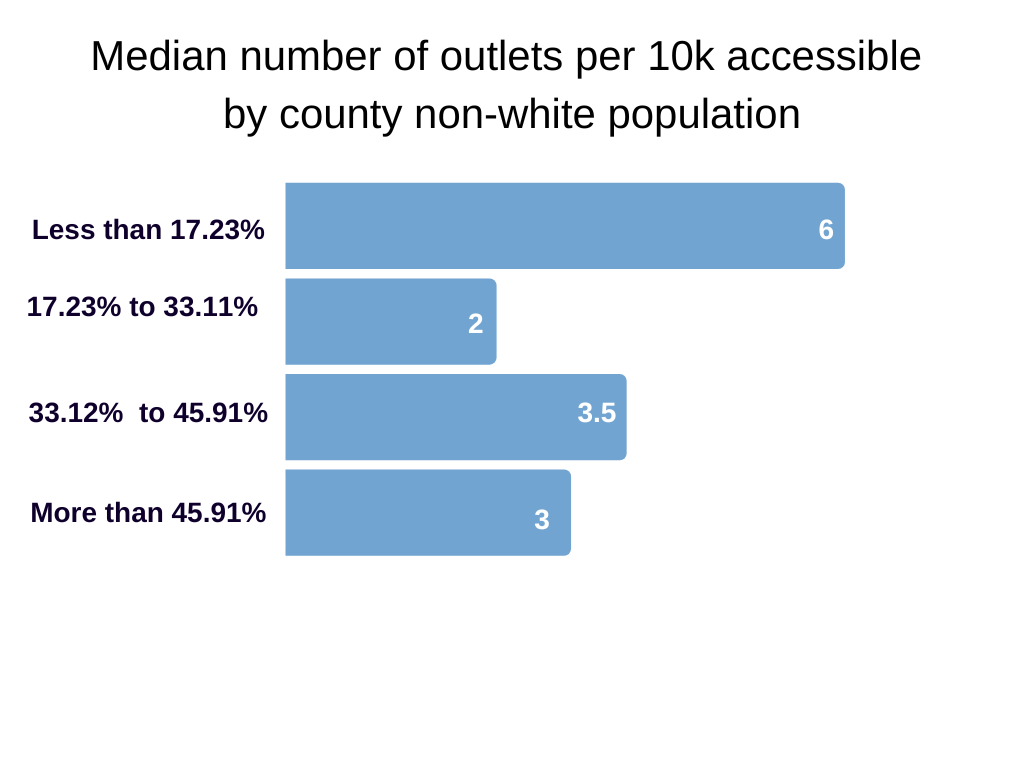
We divided counties into four equal groups — quartiles — based on the proportion of their population that did not identify as white and calculated the median number of outlets for each quartile. The chart below demonstrates the relationship between non-white population and access to local news. Counties in the first quartile, with the fewest non-white residents, have access to twice or three times more news outlets per 10,000 than counties in the other three quartiles.
What Demographic Factors Determine How Many Outlets Report on a County?
Our previous analysis found that the median number of outlets reporting on a North Carolina county was 11. However, there were considerable differences across counties. The results of a multiple regression model showed that population, the proportion of the population with a Bachelor’s degree or higher, and the proportion of the population that identified as Hispanic/Latino are significant predictors of the number of news outlets reporting about a county. Specifically, counties with a higher population were reported on by more outlets, counties with more college-educated residents were reported on by more outlets, and counties with more Hispanic/Latino residents were reported on by more outlets.
- Population and Reporting
- Educational Attainment and Reporting
- Hispanic/Latino Population and Reporting
Population and Reporting
Consistent with previous research, we again find that population is a significant factor in how many outlets report on a county. To adjust for this and make comparisons, the following analyses use a per capita measure of outlets per 10,000 residents. A median of two news outlets per 10,000 people report on North Carolina counties.

Educational Attainment and Reporting
Educational attainment, measured as the percent of a county’s population with a Bachelor’s degree or higher, was also a significant predictor of how many outlets report on a county. Counties with a higher proportion of college-educated residents are reported on by more outlets than those with lower proportions of college degree holders.
We divided counties into four equal groups— quartiles— based on the proportion of their population that has at least a Bachelor’s degree and calculated the median number of outlets per 10,000 reporting on counties in each quartile. However, when taking population into account, the relationship between educational attainment and the number of outlets per 10,000 reporting on a county changes. In this case, counties with the lowest proportion of college-educated residents are reported on by more outlets per 10,000 than those with higher proportions. This likely reflects the relationship between population and education with smaller counties tending to have lower proportions of college-educated residents. See the appendix for more details.
Overall, our findings suggest that the level of educational attainment in a county play a role in how well that county is served by local news media, but the role of education is dependent on other factors such as population.
Hispanic/Latino Population and Reporting
The final predictor of the number of outlets reporting on a county was the proportion of that county that identifies as Hispanic/Latino. Counties with a higher proportion of Hispanic/Latino residents were reported on by more outlets than those with lower proportions of Hispanic/Latino residents.
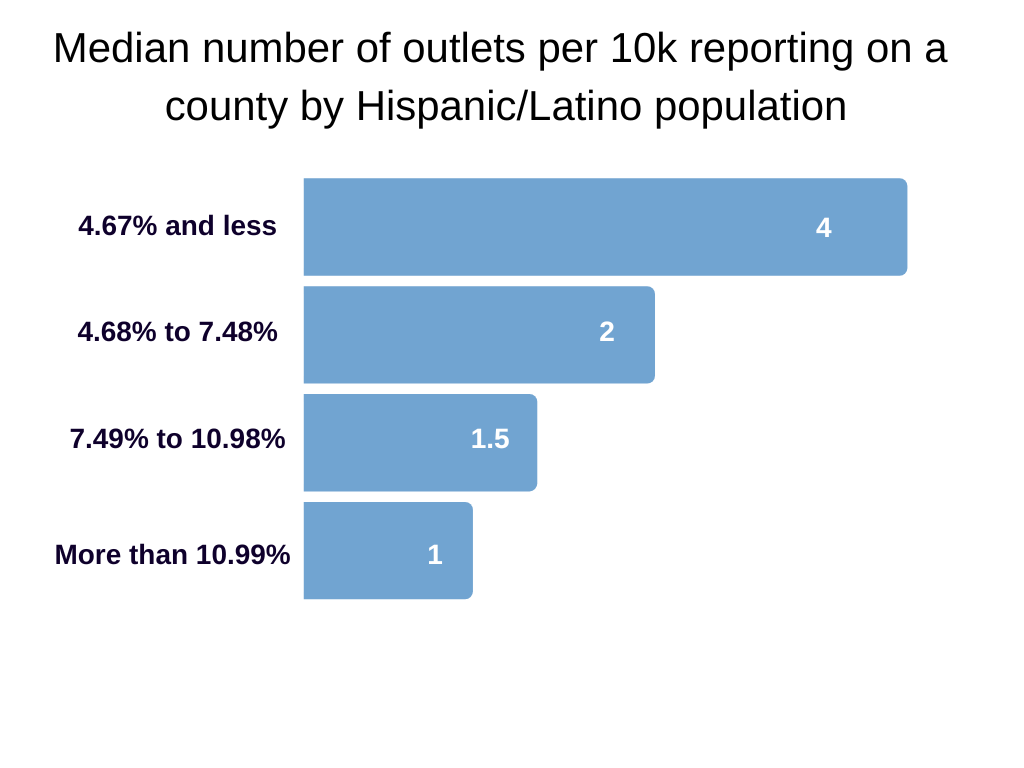
We again divided counties into four equal groups— quartiles— based on the proportion of residents who are Hispanic/Latino and calculated the median number of outlets per 10,000 reporting on counties in each quartile. Once again, as with educational attainment, this relationship looks different when accounting for population. As shown in the chart below, the median number per 10,000 reporting on a county is twice to four times higher for counties with the lowest proportion of Hispanic/Latino residents as for counties in the other three quartiles.
This latter finding is consistent with other analyses. A study of the New Jersey local news ecosystem found that municipalities with higher Hispanic populations were served by fewer local news originators per 10,000— newspapers and digital natives— than municipalities with smaller Hispanic populations. A study of the local news ecosystems of 100 randomly sampled U.S. communities also found that communities with higher Hispanic/Latino populations were served by less local and original reporting than other communities.
What Demographic Factors Contribute to the Gap Between Access and Reporting?
In general, the vast majority of counties (96%) had access to more outlets than report on them. We called this the “reporting gap.” To measure the magnitude of this gap, we used the percentage of outlets accessible to a county that also report on that county (number of outlets reporting on the county/number of outlets a county can access), which we call the “reporting-access ratio.” Therefore, the higher the percentage, the smaller the gap between access and reporting in a county.
The results of a multiple regression model showed that the demographic factors contributing to the gap percentage are total population, the proportion of the population with at least a Bachelor’s degree, and the proportion of non-white residents.
Population and Reporting Gaps
Consistent with the findings above, we again find that population is a significant factor in the gap percentage of a county. As discussed in the first part of this report, the median gap percentage for a North Carolina county was 53%. The county with the highest gap percentage was New Hanover County, with a gap percentage of 121%, meaning more outlets reported on the county than the county has access to. The county with the lowest gap percentage was Mitchell County, with a gap percentage of 16%, meaning fewer outlets reported on the county than it has access to.
Education and Reporting Gaps
Educational attainment, measured as the percent of a county’s population with a Bachelor’s degree or higher, was also a significant predictor of a county’s gap percentage.
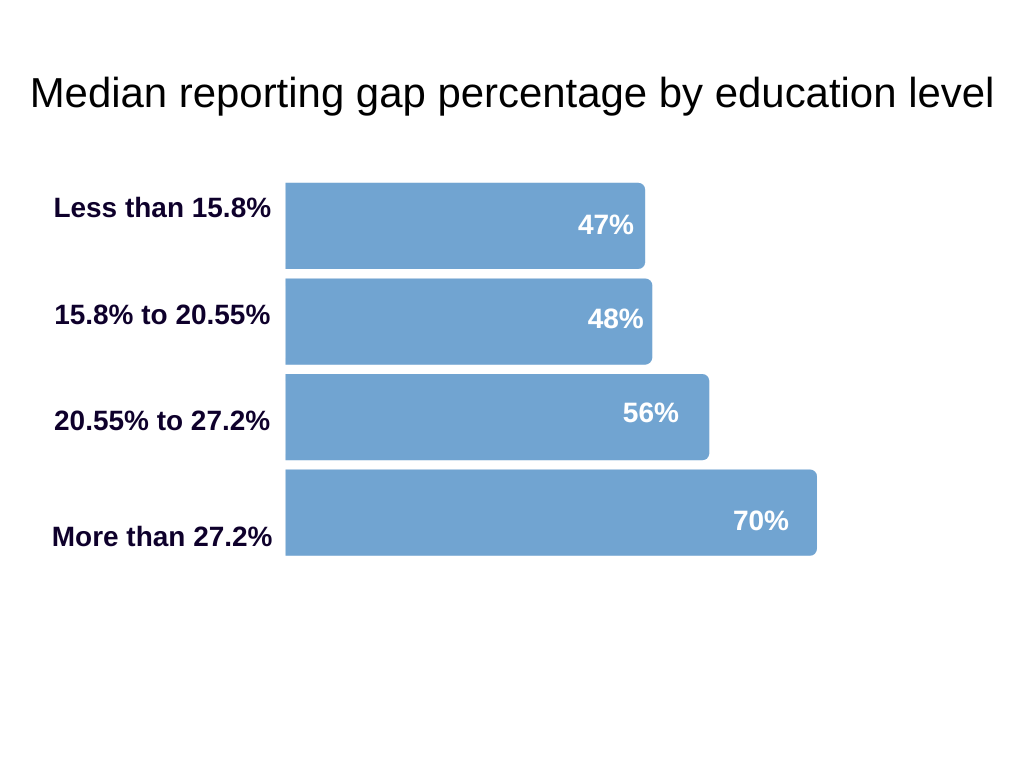
We divided counties into four equal groups— quartiles— based on the proportion of their population that has at least a Bachelor’s degree and calculated the median gap percentage. As shown in the chart below, 70% as many outlets reported on counties with the highest levels of educational attainment as are accessible to those counties, a higher reporting-access ratio than the other three quartiles.
Race and Reporting Gaps
The final predictor of the number of outlets reporting on a county was the proportion of that county that is non-white.
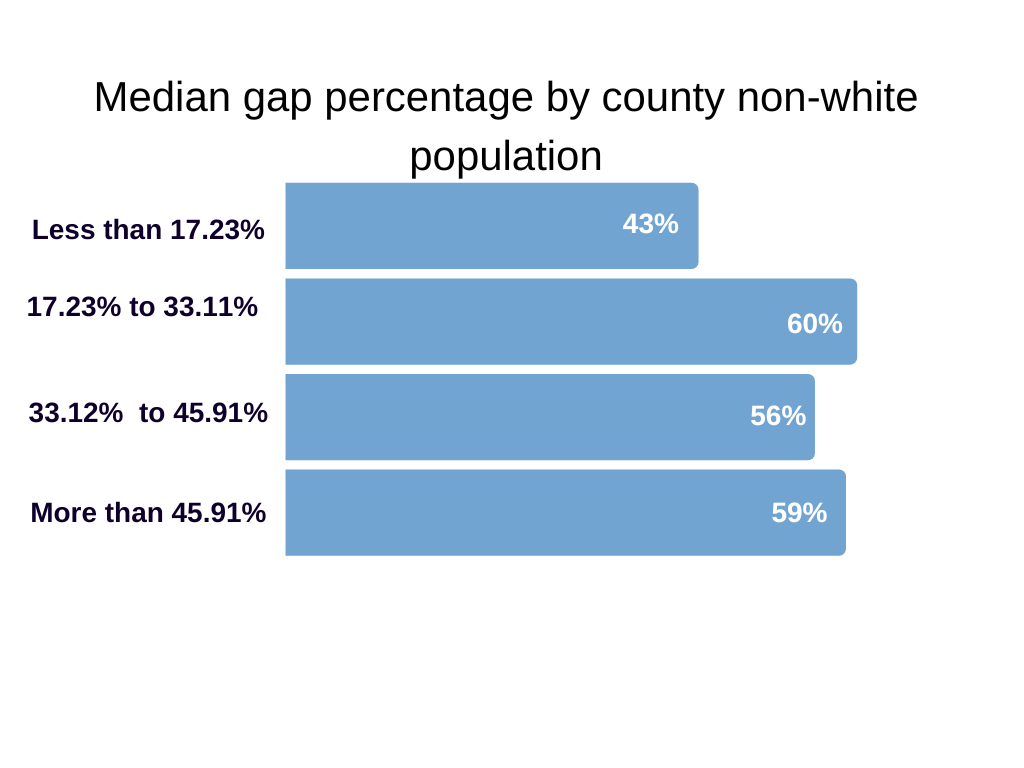
We again divided counties into four equal groups— quartiles— based on the proportion of residents who are non-white and calculated the median gap percentage for counties in each quartile. As seen in the chart below, counties with the lowest proportion of non-white residents are reported on by 43% as many outlets as they have access to, lower than the three other quartiles. In other words, the lower a county’s non-white population, the larger the gap between access and reporting outlets.
This is not necessarily in line with findings regarding race and reporting, and as seen in the correlation matrix in the appendix, this is not likely related to population. This warrants exploration in future research. Are there factors outside of those investigated in this analysis that might lead to outlets to report more on counties with higher proportions of non-white residents, such as coverage trends?